
The base rate fallacy means ignoring how common something is once a vivid detail takes over. A test that finds every case and wrongly flags only 5 in 100 healthy people still misleads when the condition is rare. With 1 sick person in 1,000, only about 1 in 51 positive results is a true case, as the disease-test arithmetic shows. This article defines the fallacy, works through the three classic studies with their real numbers, and shows the one counting test that sorts any example.
- The base rate is how common a condition or trait is in a population before any test result.
- The fallacy is judging by the specific case and dropping the base rate from the math.
- Even Harvard physicians gave 95% where the correct answer was about 2%.
- The fix is to count people, not percentages: natural frequencies make the true answer visible.
- A sorting test and a neighbors table below keep this fallacy apart from look-alikes.
What is the base rate fallacy
The base rate is the general prevalence of something: the share of a population that has a disease, drives a green cab, or studies a subject. The base rate fallacy is an error in which people ignore that share once individuating information is available, and judge probability from the specific case alone.
A doctor who hears a positive test result should weigh two facts: how accurate the test is and how rare the disease is. A witness who names a green cab should weigh the reliability of the witness and the share of green cabs in the city. The fallacy drops the second fact. The result feels certain and is often wrong.
What is the one test that sorts any example
Ask one question: out of how many people, how many end up in each group. Count people in three numbered steps.
- 1.Start with a round population, for example 1,000 people, and split it by the base rate into those with and without the condition.
- 2.Apply the test or witness to each group separately, and count the true positives and the false positives.
- 3.Divide the true positives by all positives. That share is the answer.
Percentages hide the groups. Counts show them. Every example below surrenders to this test.
Why does a 95% accurate test point at the wrong person
Take a textbook vignette from 1978. A disease affects 1 in 1,000 people. A test has a 5% false-positive rate and, as the vignette assumes, catches about every true case. A person tests positive and nothing else is known about them. What is the chance they are sick?
Count people. Of 1,000 tested, 1 is sick and tests positive. Of the 999 healthy people, 5% test positive, which is about 50. So about 51 people test positive, and only 1 of them is sick. The chance is about 1 in 51, or about 2%.
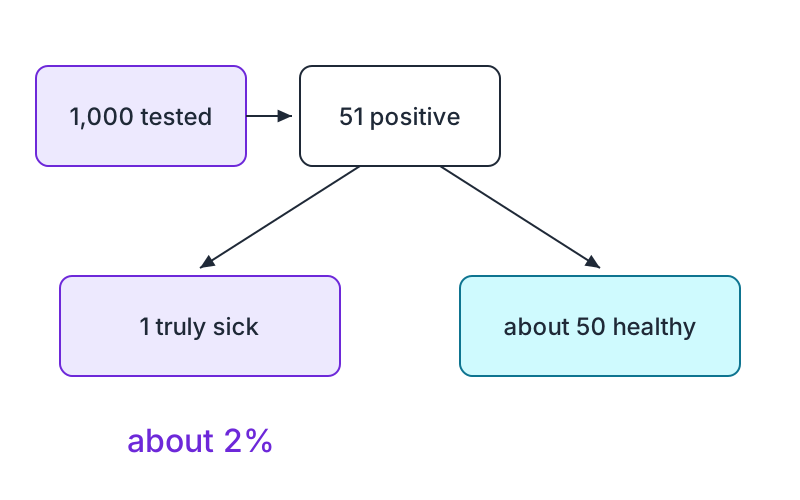
Casscells and colleagues put this vignette to 60 house officers, students, and physicians at Harvard teaching hospitals. The most frequent answer was 95%, given by 27 of the 60. Only 11 of the 60 gave about 2%. The authors concluded that formal decision analysis was almost entirely unknown in that group, and even common-sense reasoning about laboratory data was uncommon. A few years later, Eddy reported a mammography version in which 95 out of 100 physicians gave 70 to 80% where the correct value was 7.7%.
Why did the witness convince almost everyone
A city runs 85 Blue cabs and 15 Green cabs out of every 100. A cab is involved in a hit-and-run at night. A witness says it was Green. Tests show the witness tells Blue from Green correctly 80% of the time. Most people hear 80% and answer about 80%. Counting the cabs, as the classic walk-through shows, gives a different answer.
Count cabs. Of the 15 Green cabs, the witness gets about 12 right. Of the 85 Blue cabs, the witness gets about 17 wrong and calls them Green. So about 29 reports say Green, and only about 12 of them are correct. The chance the cab was Green is about 12 in 29, or 41%.
The calculation assumes the 80% accuracy holds in both directions and the witness judged a cab stopped at random. Change those assumptions and the number moves. The method stays the same.
Why did Tom W. look like a computer scientist
Kahneman and Tversky gave participants a personality sketch of a graduate student named Tom W. and a list of nine fields. In one well-known account of the study, 95% of participants ranked computer science above education and the humanities, although far more students studied in those larger fields. The sketch matched the computer-science prototype, and the prototype won.
The sketch is individuating information. The enrollment shares are the base rate. The description feels relevant because it is specific, while the dry statistic feels irrelevant because it is general. That feeling is the error. When no description competes with the numbers, people use base rates well. The trouble starts only when a vivid story crowds them out.
Why does the mind ignore the base rate
Three mechanisms share the blame, and each one points to further reading.
First, the representativeness heuristic: judging probability by similarity to a prototype. Tom W. resembles the computer-science prototype, so the mind assigns him to it and skips the enrolment shares. The heuristic is the engine; the fallacy is the crash.
Second, perceived relevance. Specific information feels worth using and general information feels safe to drop. Bar-Hillel argued in 1980 that people sort evidence by specificity before they weigh it, which is why the vivid detail beats the dry statistic.
Third, fast thinking goes unchecked. The quick system answers from the story while the slow system stays idle. Experiments show the conflict even registers: people take longer on problems where the story and the base rate disagree, yet still answer with the story. Nisbett made the related point that people also ignore consensus information about others, which is the same neglect wearing the clothes of the fundamental attribution error.
What is the difference from nearby fallacies
| Neighbour | What it confuses | How to tell it apart |
|---|---|---|
| Representativeness heuristic | Similarity with probability | Similarity starts the error; dropping the base rate completes it |
| Prosecutor's fallacy | A match given innocence with guilt given a match | A rare blood type in 10% of people does not mean 90% guilt; with a low prior the correct update is far lower |
| Conjunction fallacy | Detail with likelihood | Added detail feels more likely but a conjunction can never beat its parts |
| Gambler's fallacy | Past streaks with future odds | Independent events keep their odds; no base rate is ignored, only randomness is misread |
The prosecutor's fallacy deserves one paragraph because courts live by it. Thompson and Schumann coined the term in 1987. They showed the arithmetic with a blood-type match found in 10% of the population. A prior guilt estimate of 0.20 should rise to 0.71, not 0.90, as their paper's illustration works out. Treating the rarity of the match as the probability of guilt repeats the base rate fallacy in a courtroom. The mirror error, the defense attorney's fallacy, treats the match as uninformative because thousands share the trait, and ignores that the evidence narrows the suspect class.
Students often confuse this family with the gambler's fallacy. The test: if the puzzle gives a population share and a test or witness accuracy, it is a base rate problem. If it gives a streak of past outcomes, it is a gambler's problem.
How do you avoid it when you study
Use natural frequencies. Translate every percentage into counts of people before judging: 10 out of 1,000 instead of 1%, 8 out of 10 instead of 80%. Gigerenzer and Hoffrage found in 1995 that statistically naive participants derived up to half of their inferences by correct Bayesian rules once problems arrived as frequencies. A 2017 meta-analysis, as summarized by Simply Psychology, found frequencies raised correct answers from about 4% to about 24%, so the format helps substantially without curing the error completely. Adding a causal story helps too: accuracy rose from 8% to 46% when participants learned a harmless alternative cause of a positive result, in Krynski and Tenenbaum's 2007 study.
Slow the judgment down. Ask for the base rate first, write the counts, then look at the specific evidence. Deliberate practice with counted examples builds the habit faster than rereading definitions.
Psychology World treats terms like this one as drill material. Save base rate fallacy with its neighbors to one list, then run the Question game on iPhone and iPad until the counting test answers itself. Search inside definitions and study progress are Pro features that support this routine.
Frequently asked questions
What is the base rate fallacy in simple words
It is judging a single case by its vivid details while ignoring how rare or common the outcome is in the population. The specific story feels informative, so the general statistic gets dropped, and the answer goes wrong.
What is a real example of the base rate fallacy
A disease test with a 5% false-positive rate goes to a population where 1 in 1,000 is sick. It returns about 51 positives, of which only 1 is a true case. Most people guess about 95%. The correct answer is about 2%.
What is the cab problem and its answer
A witness who is right 80% of the time says a hit-and-run cab was Green in a city with 15% Green cabs. Counting cabs gives about 12 correct Green reports out of about 29, so the answer is about 41%, not 80%.
How do you avoid the base rate fallacy
Turn percentages into counts of people, look for a causal explanation of the evidence, and slow down before answering. Natural frequencies make the false positives visible, which is where the error hides.
What is the difference between the base rate fallacy and the prosecutor's fallacy
The base rate fallacy is the general error of dropping prevalence from the judgment. The prosecutor's fallacy is its courtroom form: reading the rarity of a forensic match as the probability of guilt.
Sources
- 1.Hoffrage and Gigerenzer (2004). How to improve the diagnostic inferences of medical experts.
- 2.Gigerenzer and Hoffrage (1995). How to improve Bayesian reasoning without instruction: Frequency formats.
- 3.Thompson and Schumann (1987). Interpretation of statistical evidence in criminal trials.
- 4.Stanford Encyclopedia of Philosophy. Bayes' theorem.
- 5.Wikipedia. Base rate fallacy.
- 6.Simply Psychology (2026). Base rate fallacy.
- 7.The Decision Lab (2019). Base rate fallacy.
- 8.EBSCO Research Starters (2020). Base rate fallacy.
- 9.Fallacy Files. The base rate fallacy.